
Valuing NFTs
Running the numbers on NFT valuations

Shortly after publishing my last article (which you should probably read first), I started to feel bad. Not because my thesis was wrong, or my prediction would be off, but because I had no data proving that I was wrong in the first place. I am back now to try and make sense of the messy world of valuing NFT collections.
Let’s start with art. When was the last time you tried to value a piece of art? If you are like me, your interaction with art prices may consist of a local art shop with pieces ranging from hundreds to a few thousand dollars. Or, if you are the type who frequents museums, you may have run into a few “priceless” pieces here and there. But outside of art investors and collectors, valuing individual art pieces is not something that most people do very often.
Finding the market cap of anything that’s “non-fungible” is difficult because anything that isn’t fungible is inherently illiquid. Go try and find the total market cap of every Da Vinci piece, it doesn’t exist. Or the total value of every Basquiat painting, also doesn’t exist. The reason is simple: we don’t know how much any of their paintings are worth, aside from any that just sold. Take all the “priceless” pieces out of it, if we wanted to find the market cap of Da Vinci’s in private collections, it’s still not possible with any degree of accuracy. How do we accurately value a piece that hasn’t traded hands in 50 years?
NFTs run into the exact same issue. Last year, Beeple’s The First 5000 Days sold for an astonishing $69.3 million. How much is it worth now? Well, considering it hasn’t traded since, we have no idea. But we can at least estimate what we think it would be, and judging by the rest of the NFT market, it’s probably a lot less. But this is just one piece, Beeple has dozens of NFTs that will run into the same problem.
Now despite spending the last few paragraphs complaining about why it’s so hard to calculate market cap for collections of non-fungible assets, I will now attempt to calculate the market cap for collections of non-fungible assets.
Remember that the assumption from my last article was that the top 5 10K projects are larger in market cap than the top 5 artist generated NFTs. The prediction was that this will also be true on 11/15/2027.
10K Projects
The best way I can think of to get the market cap for a 10K project would be to assign a dollar value based on each attribute, use the attributes to determine the price of each piece, and then sum them up. This is beyond the scope of the work I want to do for this paper, and maybe by the time I re-evaluate my prediction someone will have done it. (Basically taking these numbers as inputs and outputting an estimated value). But for now, I am going to go with the simpler, more conservative way to do it — using the floor price times the total quantity.
The floor price is the lowest price an NFT of a single collection is currently being offered for. Therefore, if the lowest CryptoPunk offered is going for 65 ETH, then we can make a rough estimate that the market cap is 650,000 ETH (65 * 10K). Of course, this amount is far from perfect, and probably reflects the lower bound of what the market cap is.
Conveniently, this seems to be exactly what Coinmarketcap (CMC) is doing.
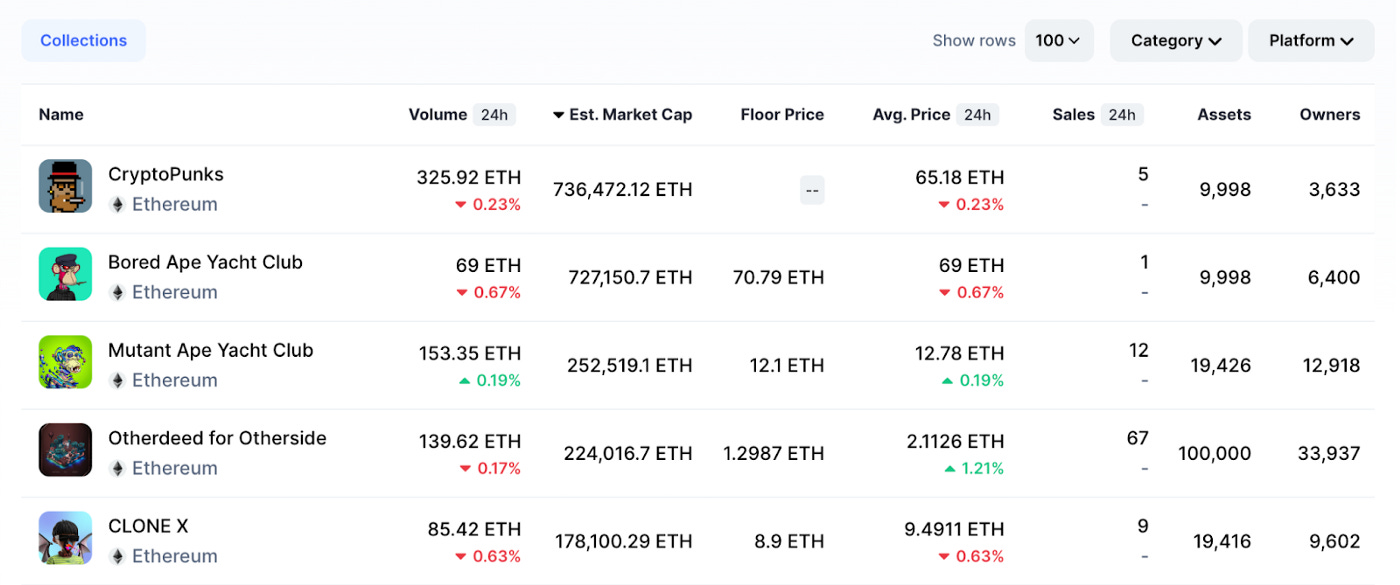
I thought we said finding NFT market caps was hard? 10K project NFTs are different than individual art pieces in variability of each piece. For example, Da Vinci’s Salvador Mundi famously sold for $450 million in an auction. But that doesn’t really tell us much about the value of any other Da Vinci pieces other than they are probably a lot. Conversely, Bored Apes are conveniently pretty damn similar and have interchangeable attributes that make them relatively easy to value. This similarly makes recent sales more useful for valuing the entire collection.
But can we take the CMC market caps at face value? Considering CMC doesn’t have a floor price for Punks, maybe we should dive in a little. Coingecko has a market cap 73,000 ETH less than the CMC one for the Punks.
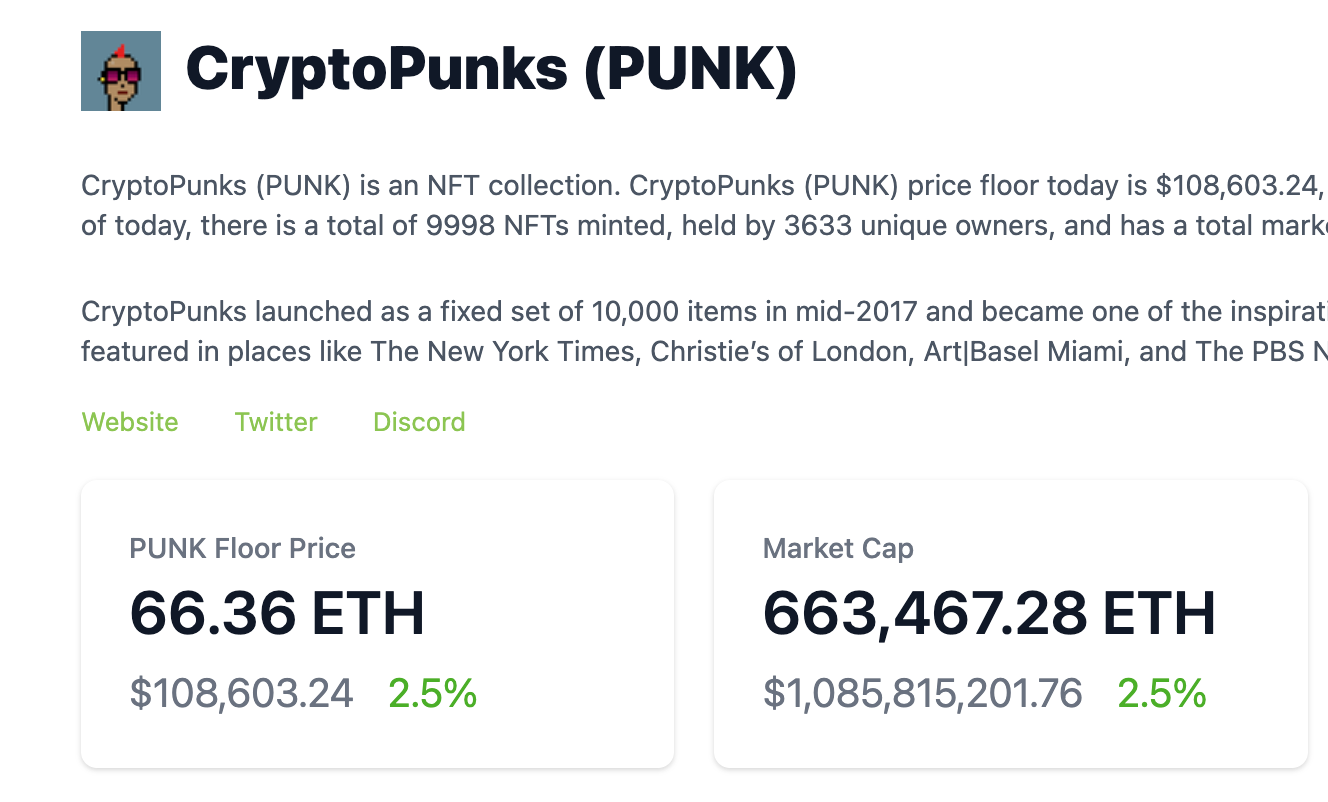
CoinGecko’s marketplace I can tie out — the cheapest Punk for sale right now is 66.36 ETH, multiply that by 10K and you just about get the 663,467 ETH market cap. But as I mentioned above, this will be the lower bound since it’s safe to assume that the average price of each Punk is higher than the floor price. Might CMC’s market cap of 739K ETH be more accurate?
I am going to go with 739K until I can prove otherwise. Let’s move on to Apes.
CMC has the Bored Apes with a floor price of 70.79 ETH, but CoinGecko has 66 ETH, and Nftpricefloor has 65 ETH. I am really not sure what is happening here, but I am going to go with CMC again because OpenSea has the BAYC floor as 70 ETH.
Aha! I figured out why CMC has no floor price for the Punks. It appears like they are just piping in the floor price data from OpenSea, which also has no floor price for Punks.
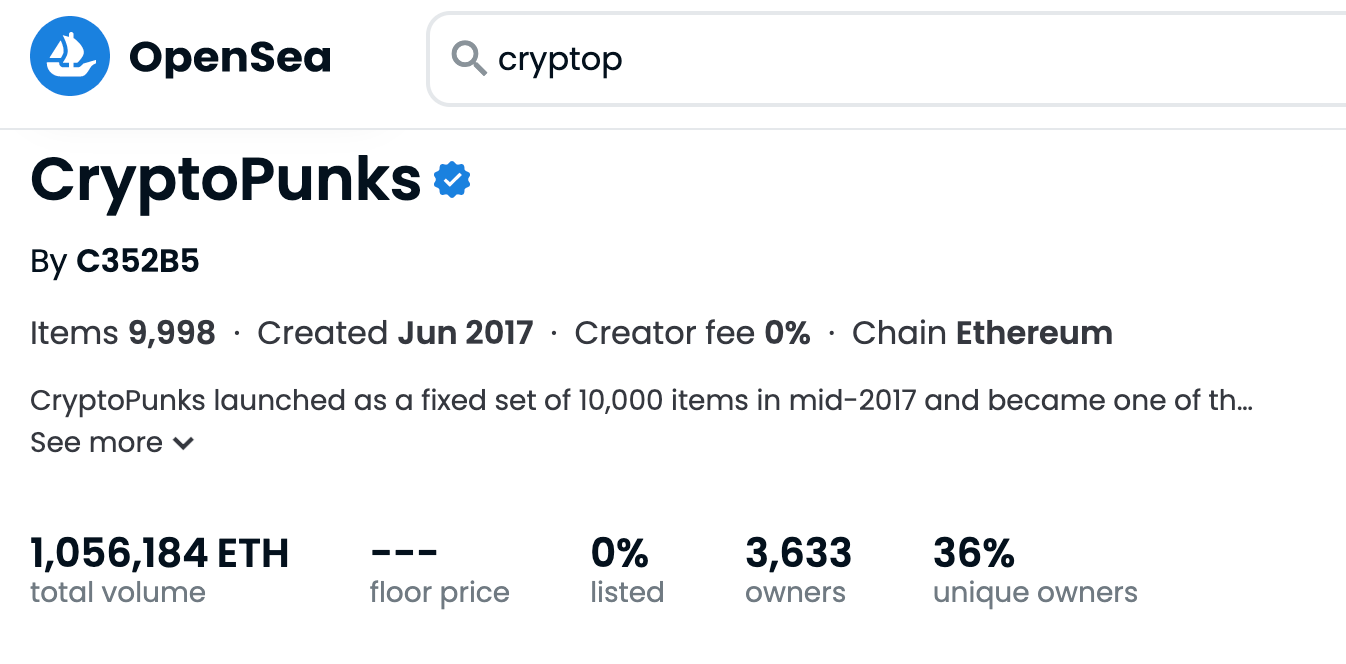
For the sake of time, I am going to just trust CMC for the remaining market caps. I still don’t know how they are determining the CryptoPunks one, but it seems in the right ballpark for me to be comfortable with it. The other floor prices are just coming from OpenSea, which is probably the most accurate place to get them.
But before that, lets just compare it to the top 5 on Coingecko first to see what happens. Looking at CoinGecko’s top chart gives you a good idea of the quality of the data sets that we are working with here. The market cap column is clearly sorting on nominal value of coins instead of market cap in USD, which is why “Chikn”, with a market cap of 1,000,000 AVAX is higher than crypto punks with a market cap of 663,000 ETH.
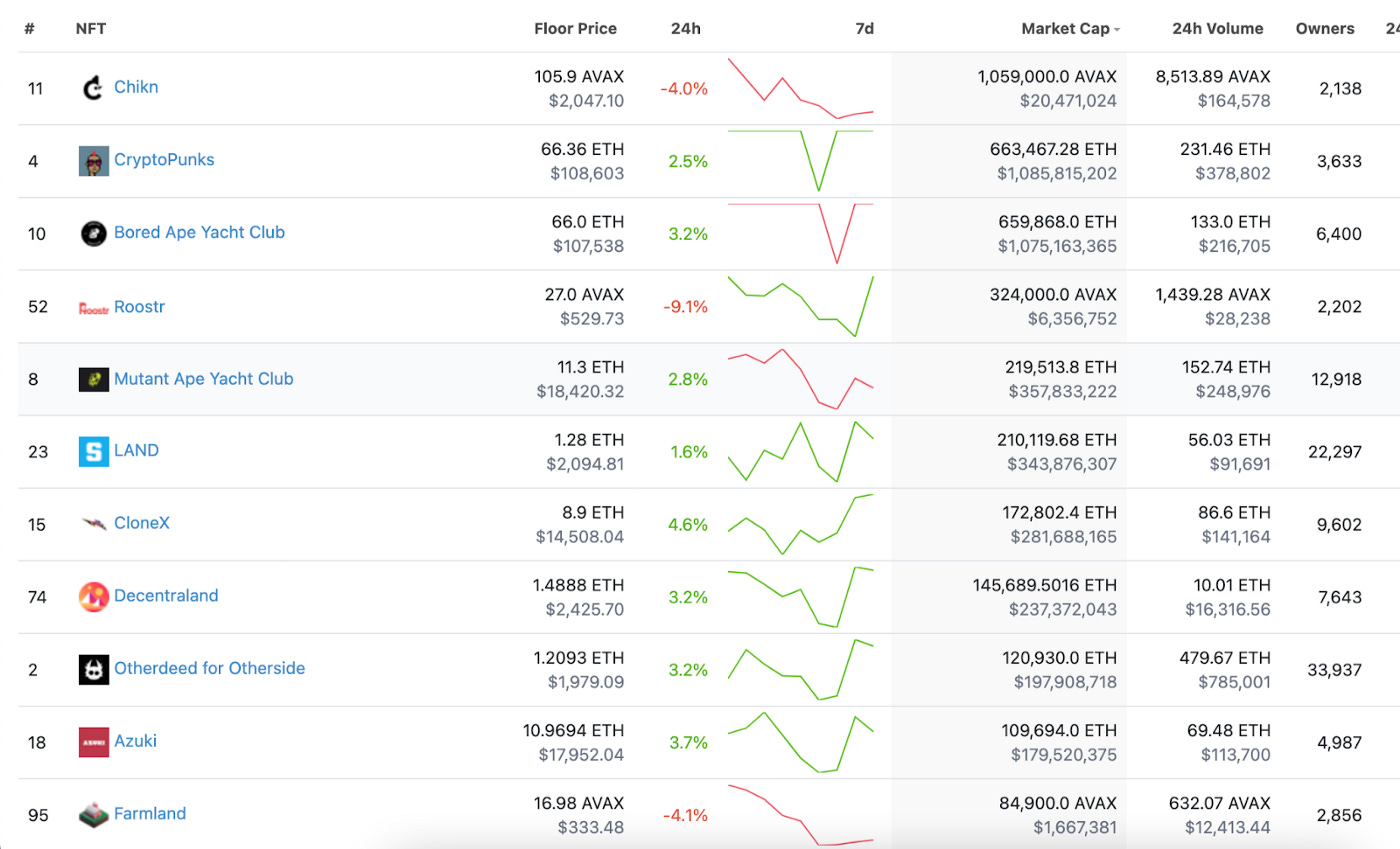
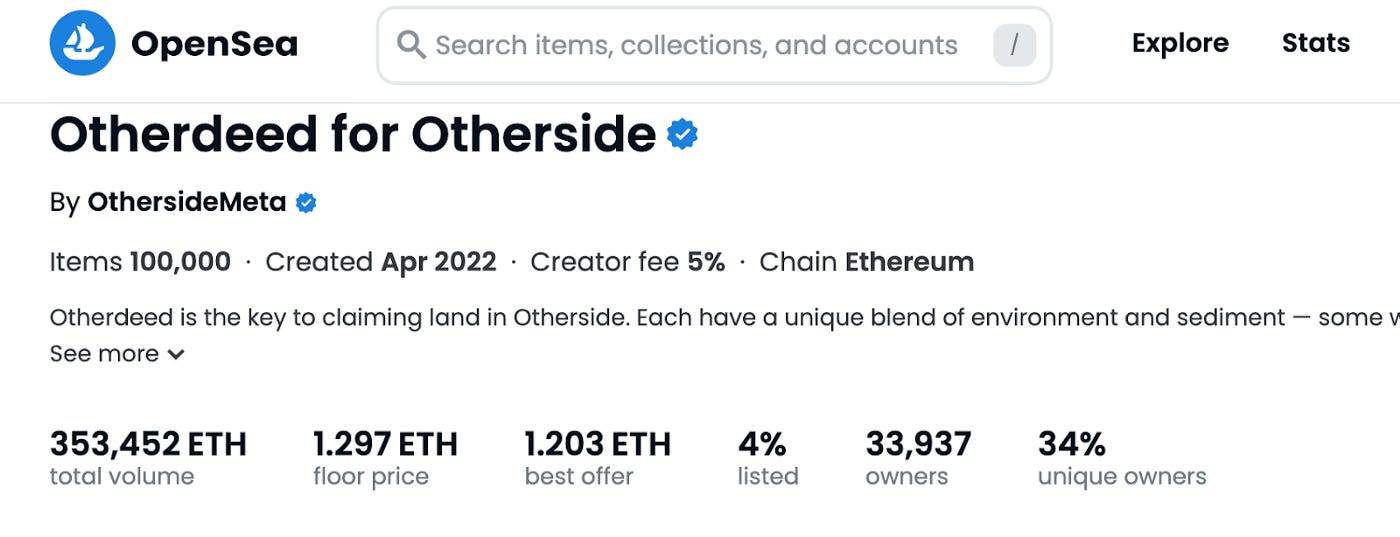
But either way, if we get rid of the non-ETH projects, we end up with a list almost identical to the one from CMC. The only difference is that they have Otherdeed switched with Clone X at rank 4 and 5. Looking at the numbers, CMC and CoinGecko disagree on Otherdeed, which CMC has at 224K ETH and Coingecko has at 120K ETH. Big difference.
I think I need to take CoinGecko’s number on this one, I really am not sure how CMC is getting their number. The floor price of Otherdeed is 1.3 ETH on OpenSea and there are 100K pieces, which puts it at much closer to 120K ETH than 224K.
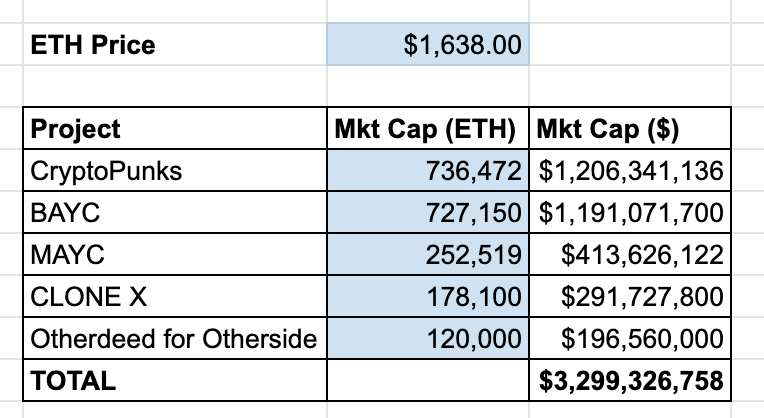
If you are still with me after stumbling through that mess, here is our — very rough — total market cap of the top five 10K projects:
Now let’s try to do the same thing for artist generated NFTs.
Artist Generated NFTs
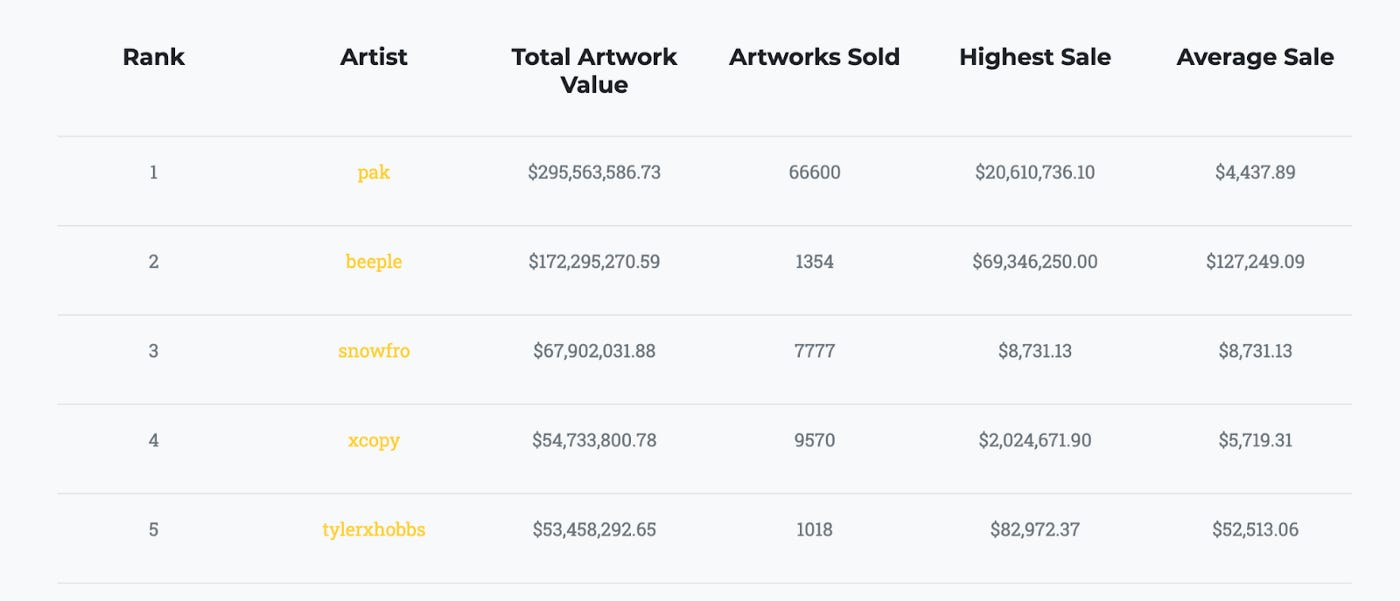
At first glance, this is going to be much harder than the 10K projects because, like meatspace paintings, artist generated NFTs are highly variable, don’t have interchangeable attributes, and have lower liquidity. However, I was able to find this list, which is using the average sale price and multiplying it by the number of pieces sold. Considering this will save us hours of inaccurate, time-consuming valuations, let’s see how this methodology holds up.
Below is a screenshot of the top 5 artists on the list.
And here is the disclaimer at the bottom of the web page:

The first bullet is basically telling us that the average sale value is going to change with the price of the crypto asset (ETH) that the piece was sold in. This should make the total artwork value much more accurate, since NFT values have cratered at least as much as ETH prices. It also normalizes it against how we did the 10K projects, which had their market caps denominated in ETH. The real question is if the average ETH value went down as well. I am going to assume they fell slightly, but mostly remained flat.
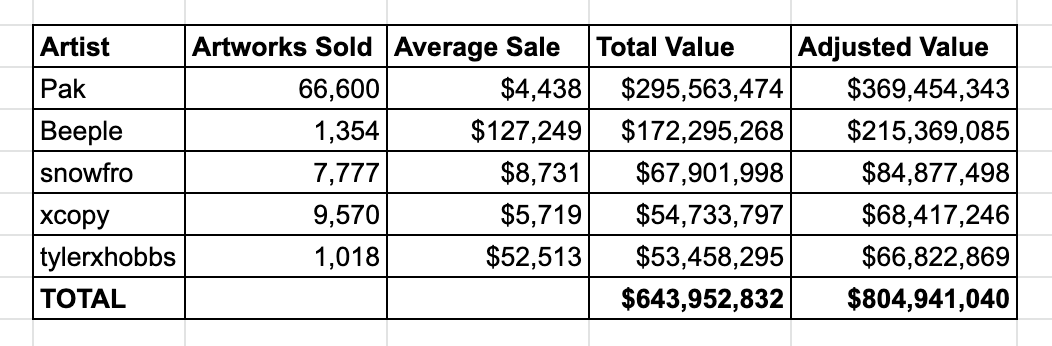
The second bullet doesn’t help us, but the third bullet opens up some questions. Why do credit card sales not make it in the list? Most NFT exchanges accept credit cards, so this has the potential to really throw off our numbers. The average sales should give us a little insight into the effect of the credit cards — surely more credit cards were used to buy $4K Paks than $127K Beeples. So for the sake of being conservative, let’s assume that a quarter of all sales were with a credit card. Adding another conservative assumption, I am going to leave the average sale price as it is, despite the fact it would drop after we included the credit card purchases.
Putting it all together we get an adjusted value of $805M.
Conclusion
Ok, time to compare…
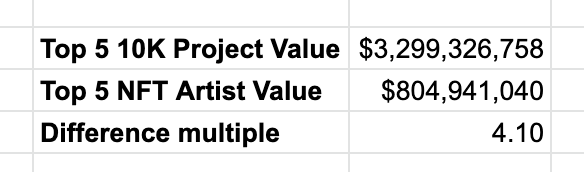
It’s not even close. The aggregate market cap of the top 5 10K projects is more than 4 times larger than the top 5 NFT artists. I suspect this multiple would get even greater as we expanded to top 10 and top 50.
Now of course, these are very rough estimates. The actual values are likely much different than what I’ve cobbled together here. However, the *real* values would actually widen this gap instead of closing it since our artist NFT value of $804M is most likely overstated from the credit card purchases and our 10K market cap of $3.3B is understated due to the floor price methodology.
So there you have it. While the calculations I used were extremely lazy, I don’t think it’s possible to argue that the total value of the top 5 NFT artists come anywhere close to the 10K projects.
I now have the numbers backing up that I was wrong, and have a rough methodology to follow when I check back up in 5 years.