
Cryptocurrency as a New Asset Class
Breaking down the investment case for cryptocurrencies


Since the creation of Bitcoin in 2009, crypto has evolved into a new asset class designed for the digital age. The industry has matured enough to begin analyzing how crypto assets fit into a traditional portfolio. This series will look at the different investment theses of crypto assets, along with the qualitative and quantitative comparisons of crypto in relation to Modern Portfolio Theory.
Part 1: Thesis Overview
Part 2: Returns & Volatility
Part 3: Correlations with Traditional Asset Classes
Part 4: Building the Portfolio
Part 1: Thesis Overview
Before comparing crypto to other asset classes, the first question is why it’s an asset class in the first place. What are the value propositions that will potentially drive the returns? When looking at crypto assets it’s important to realize that crypto as a whole contains a plethora of different use cases depending on the blockchains in question. Just as you wouldn’t inquire into the use case of equities, the same holds for crypto.
I will go through the two investment theses for crypto that are most commonly discussed: macro-economic currency hedge and Web 3.0 Infrastructure.
Hedge Against Macro-Economic Turmoil
Perhaps the most formalized investment thesis for crypto is as a macro-economic hedge. This pertains primarily to Bitcoin, but also includes Litecoin, Zcash, Monero, Grin, et al. The idea behind this thesis is that Bitcoin offers an opt-out of a world in which negative yields, quantitative easing, currency devaluations, and trade wars, have become the norm. To put it concisely, Bitcoin acts as a call option on the instability of the global economic monetary system.
This thesis happens to be very similar to that of precious metals, particularly gold (which is why Bitcoin often gets referred to as digital gold). The argument then turns to why Bitcoin is superior to gold for someone trying to make this hedge. In short, Bitcoin beats out gold in nearly every category one would use in determining a strong store of value (portability, divisibility, scarcity, verifiability, etc.).
Two of the bull case outcomes to the macro-hedge thesis are: 1) Bitcoin replaces gold as the standard safe haven asset or 2) Bitcoin becomes the global reserve currency. If Bitcoin can achieve even half of the market cap of gold, it would lead to a price of ~$200K per Bitcoin ($148B vs $7T mkt cap). As for the second outcome, if central banks begin filling their balance sheets with Bitcoin, the future price could potentially be even higher.
While these outcomes admittedly have a low probability of occurring in the near term, the risk-return trade-off should not be ignored. And even if neither outcome is realized, having a censorship-resistant method of transferring value anywhere in the world, even if used only in niche scenarios, will always carry value.
If you would like to dive further into this investment thesis, I recommend:
Vijay Boyapati’s The Bullish Case for Bitcoin
Ark Invest’s Bitcoin: Ringing the Bell for a New Asset Class
Web 3.0 Infrastructure
The second most prominent crypto asset investment thesis is focused on smart contracts, tokens, and Web 3.0 infrastructure. The crypto assets relevant here are Ethereum, EOS, Tezos, and other smart contract platforms. While the previous investment thesis had the benefit of piggy-backing on gold’s value proposition, the potential value of smart contracts in a digital world is far less defined.
A smart contract is a binding digital agreement in the form of code, available to anyone, that is fulfilled on a blockchain when certain conditions are met. Once the smart contract is deployed, it is governed only by the code it contains. By linking these contracts together, you are able to create pseudo-organizations that exist exclusively online, under no jurisdiction. Ethereum is the most well known example of a smart contract platform, in which its native currency, ETH, is used as the fee to run these smart contracts.
To understand the thesis of smart contract, protocol-level blockchains, it helps to look at Internet 1.0. The standard protocols that act as the backbone of the Internet (TCP/IP, HTTP, SMTP, etc.) are an agreed upon set of rules that computers follow to communicate with each other. However, value did not accrue to these protocols themselves but at the layer above. Proof of this is evident if you compare the net worth of Zuckerberg or Bezos, with that of Tim Berners-Lee, who had a lead role in building the Internet.
The difference this time around is that blockchains enable value to accrue at the protocol level due to the transaction costs inherently embedded in the smart contracts running on it. One way to put it is “If Bitcoin is akin to digital gold, then Ethereum is digital oil”.
A number of questions remain to be answered. Will one protocol take the lion’s share of the market or will it be more evenly distributed? Will the value accrue to the base level protocol or the tokens & protocols above them? What is the value in having voting/governance rights for a protocol?
While this thesis is harder to quantify, the potential for these smart contract platforms to dramatically change the way we interact online and with internet-connected devices is apparent.
For more information on this thesis I recommend the following:
Joel Monegro’s Fat Protocol Thesis
Felipe Gaúcho Pereira’s Visions of Ether
Overall, crypto assets have the potential to dramatically shift the current global paradigms. While the chances of some of these bull cases occurring may be slim, the potential returns may be large enough to justify the associated risks. There are also additional use cases beyond the scope of this article, such as: privacy, remittances, tokens, “defi”, prediction markets, stablecoins, and more.
Most experts would agree that crypto assets are here to stay. The question now becomes how to analyze this asset class from a risk-reward perspective.
Part 2: Returns & Volatility
Lets now begin comparing crypto to traditional assets in terms of historical returns and volatility. Through this analysis we will see that Bitcoin’s volatility isn’t too far outside the range of some well known stocks. Additionally, the returns that Bitcoin has yielded have been more than enough to compensate for the associated volatility.
Data
The data used for this analysis is pulled from January 2014 to October 2019. Crypto data before 2014 is less useful for our analysis due to the low volume and lack of transparency. We will also exclusively use Bitcoin when comparing to traditional assets. This is due to Bitcoin having the most established history and volumes closer to that of traditional assets. The majority of other crypto assets were and are too thinly traded to be considered in this analysis.
However, Bitcoin works as a strong proxy for the crypto industry as a whole, with most crypto assets being highly correlated to the price movements of Bitcoin. This is similar to how the S&P is used as a proxy for equities.
The traditional assets we chose to include in the analysis were AMD, Facebook, S&P 500, and GLD.
Returns
The first piece of analysis focuses on the most commonly discussed metric: returns. Below is a chart showing the yearly returns for each of the assets from 1/1/2014 to 10/3/2019.


Bitcoin yielded the best returns, appreciating more than an order of magnitude over the last 5 years. AMD (the stock with one of the highest trade volumes) also posted a return of 626% over the same time frame.
Below is a graph depicting the value of the asset over 5 years assuming that $1000 was invested on 1/1/2014.

Even having gone through a significant bear market in 2015 and 2018, a buy and hold strategy with Bitcoin would have posted significantly better returns than the other investments in this analysis.
However, what level of volatility accompanied these returns?
Volatility
Below is a chart showing the annualized volatility of each of the assets using daily returns.

The volatility stacks up closely to the returns, with the highest returning assets showing the most volatility (BTC & AMD).
Much of the volatility can be explained by the size of these assets. Below is a chart showing the market caps of each asset (gold does not include jewelry & industrial uses).

Therefore in the future we can expect Bitcoin’s volatility to drop as its market cap and liquidity rise. As Bitcoin matures, it will still exhibit characteristics consistent with the hype cycle common amongst new technologies, however its volatility should trend downward as it becomes more established and better understood.
Sharpe Ratio
Given the returns and the volatility, how does Bitcoin’s Sharpe Ratio stack up against traditional assets?
The chart below is a more encompassing view of traditional assets, and we can see that Bitcoin’s risk adjusted returns are strong when compared to the traditional asset classes.

As we have seen, Bitcoin’s outsized returns have more than compensated for its volatility. Let's now dig deeper into the correlations between Bitcoin and traditional assets.
Part 3: Correlations with Traditional Asset Classes
We will now look at Bitcoin’s correlation with equities, gold, and other crypto assets.
Modern Portfolio Theory
Modern Portfolio Theory (MPT) tells us that we can maximize the expected return of a portfolio by taking on a quantifiable amount of risk, a la diversification. In fact Harry Markowitz, the creator of MPT, is quoted as saying, “Diversification is the only free lunch in investing”. Almost always, owning different types of financial assets is less risky than owning one type.
Diversification of equities helps reduce idiosyncratic risk for a given company or industry, but systemic risk is more difficult to diversify away. An asset that provides strong expected returns without correlation to the rest of your portfolio should be considered an opportunity for increased diversification.
We make the case that bitcoin acts as the perfect asset for improved diversification due to its historically low correlations with traditional assets.
For the purposes of this analysis we will be using Pearson 180-day arithmetic correlations. Charts provided by Coinmetrics.
Correlation with the S&P
Below is a chart showing the correlation of bitcoin and the S&P over the last 6 years.
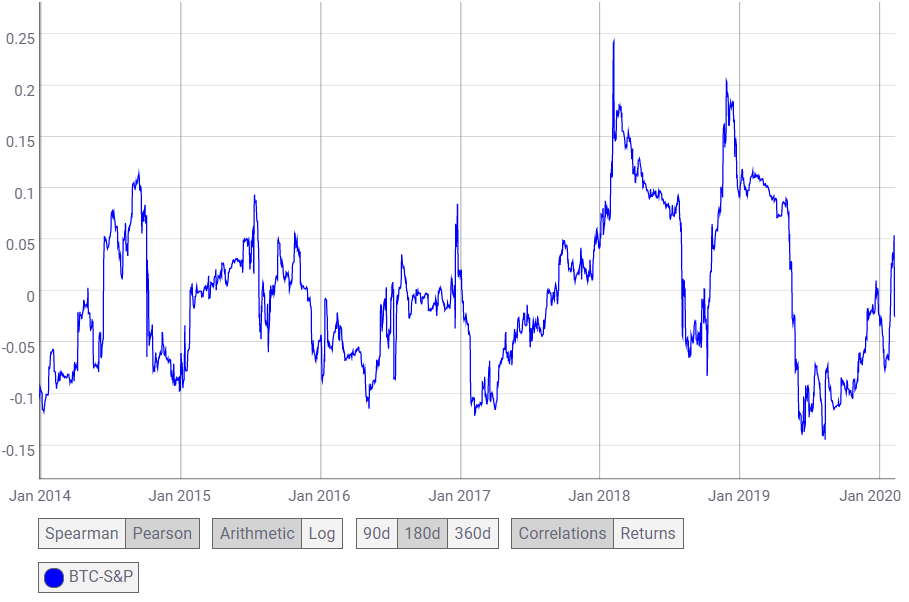
BTC has hovered between -0.1 and 0.1 correlation with the S&P for the majority of the period. The highest 180-day average reached was during early 2018 with 0.24. Even at the highest point, it still falls in the range of -0.3 to 0.3, implying a weak correlation.
For reference, let’s layer on gold’s (GLD) correlation with the S&P as well.

Both BTC and GLD maintained low correlations with the S&P over the last 6 years. One interesting thing to note from this chart is the correlations seem to diverge consistently in opposite directions.
Correlation with Gold
Since we know that BTC and GLD both have a low correlation with the S&P, what about their correlations with each other?

BTC does not appear to have any more of a correlation with GLD than it does with the S&P. This is significant in that BTC does not have to act as a replacement to GLD in a portfolio but as a complement.
Correlation with other Crypto Assets
Throughout this analysis we have been using bitcoin as a representation for crypto as a whole, largely due to its age, liquidity, and relative quality of data. Another reason bitcoin acts as a strong proxy for the crypto market as a whole is because of its’ strong correlation with other crypto assets. The market currently thinks of crypto as a single entity which naturally leads to higher correlations.
Below is a chart that shows BTC’s correlation with some of the other high market cap crypto assets.
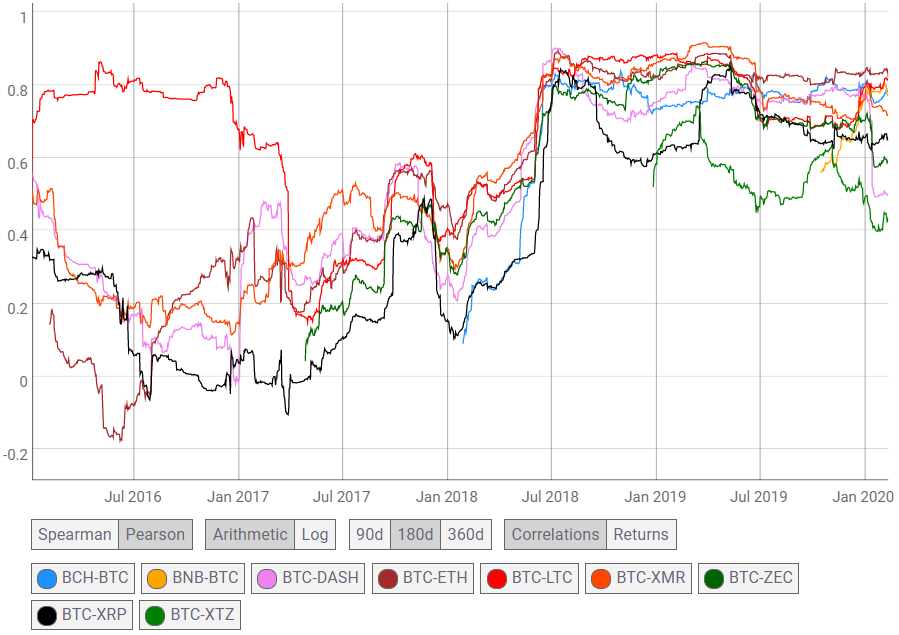
The primary observation from this chart is the correlation among large crypto assets and bitcoin increasing over time. We offer two considerations that may help in explaining the trends seen in this chart:
Crypto assets have very low liquidity early in their lives, which leads to extreme price swings that can be triggered by a few large trades. We can expect this will lead to lower correlation with the larger liquidity assets (bitcoin) until a threshold of maturity is reached. Many of the assets in the analysis above were not created until after 2015: Tezos (2018), Binance Coin (2017), Bitcoin Cash (2017), et. al.
2017 was a year with massive, many-times irrational, price gains. This was especially true for “alt” coins, or non-bitcoin crypto assets.
The combination of a frantic bull market with low liquidity coins was the reason for lower correlations between crypto assets prior to 2018. With the the market normalizing and some of these coins maturing, we saw a convergence of correlations to BTC.
In Part I, we discussed the diverse use cases for crypto assets, which may lead some to expect lower correlations among them. The tight correlations between these assets is due to a lack of understanding of these differences. As the different use cases for these assets become more understood, we expect the correlations between fundamentally different blockchains, such as BTC and ETH, to trend lower into the future.
Bitcoin can improve the expected return of a well-diversified portfolio due to its lack of correlation with the S&P and even gold.The correlation between crypto assets and BTC has trended stronger over the last two years, but we expect there to eventually be a divergence. This implies that there may be diversification implications within the crypto portion of a portfolio.
Lastly, we will add crypto to a diversified portfolio in various allocation amounts to evaluate the impact on risk and return.
Part 4: Building the Portfolio
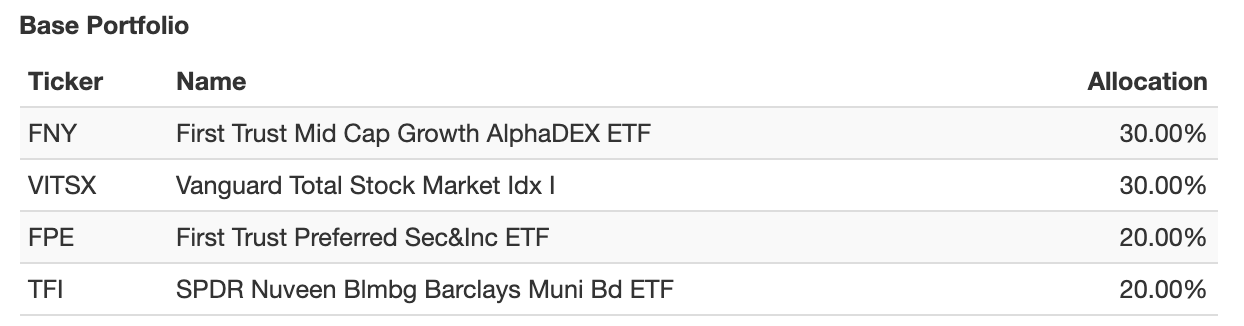
We must first build a traditional portfolio that we will use as a baseline for our analysis. Our base portfolio will be 60% equity and 40% fixed income. This portfolio was chosen to represent a standard allocation for the average person.
Equity ETFs: Mid cap growth mixed with the broader market
First Trust Mid Cap Growth AlphaDEX ETF (FNY)
Vanguard Total Stock Market Idx I (VITSX)
Fixed Income ETFs: Constituting corporate and municipal debt
First Trust Preferred Sec & Inc ETF (FPE)
SPDR Nuveen Blmbg Barclays Muni bd ETF (TFI)
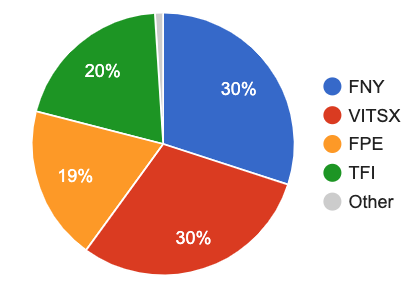
Below is the allocation of our base portfolio. (Portfolio tool provided by Portfolio Visualizer)

We will now introduce Bitcoin (BTC) allocations of 1% and 3% to our portfolio.


Settings
Our analysis is based on the assumption that $10,000 was invested in the portfolio on 1/1/2015 and rebalanced each quarter.
As in the previous articles, BTC was used instead of a crypto index because of the length of time that reliable BTC price information is available; 2015 is the year in which said data became reliable.
Analysis of Returns
We will first look at the returns of each of the three portfolios.


These two charts reflect what was expected for the returns of the portfolio. Just a 1% allocation to BTC both improved the Compound Annual Growth Rate (CAGR) by more than 1% and returned 55% (15,510 / 10,000–1) over the five years as opposed to 46% (14,613 / 10,000–1) from the base portfolio.
Also, the losses in 2018 were greater with more BTC allocated into the portfolio. Interestingly, 2020 was an exception to this even though 2020 is only reflecting Q1. The BTC allocated portfolios have fared slightly better than the base portfolio. We will be keeping a close eye at how BTC performs into 2020, especially with the volatility being seen across all financial markets.
Volatility and Correlation

The standard deviation of the portfolio increases as more BTC is introduced, however with a 1% increase to BTC we see the standard deviation in the period only 0.1% greater than the base portfolio. This shows that a 1% allocation to BTC may not increase the volatility of a portfolio as much as one may expect.
Perhaps the most important metric is the increase of the Sharpe and Sortino ratio through increases in BTC allocation. The increased return we are seeing is more than enough to compensate for the increased volatility.
The correlations with the US mkt did not seem to change much with a 1% allocation to BTC, going from 0.96 to 0.95. However, the 3% allocation saw this drop to 0.91. This decrease of market correlation without sacrificing expected return is exactly what an uncorrelated asset like bitcoin is supposed to do.
Verdict
Based on these results, we believe the extra returns provided by BTC to be greater than the increased volatility. A 3% allocation to BTC may prove to have more volatility than a risk-averse investor is willing to take on. However for a more aggressive investor, a 3% or greater allocation to BTC may be appealing.
I highly recommend trying this out on your own. Odds are, adding incremental allocations of BTC to your portfolio will see your risk-return profile increase and your correlations go down.
Disclaimer: The views expressed in this article are solely opinions of the author and do not represent financial or legal advice whether to buy, sell or hold shares of a particular cryptocurrency, cryptographic asset, stock or other investment vehicle. Prior to trading, investing or purchasing any assets, individuals should consult with their own tax, financial or legal advisor. Past performance is no guarantee of future price appreciation.